
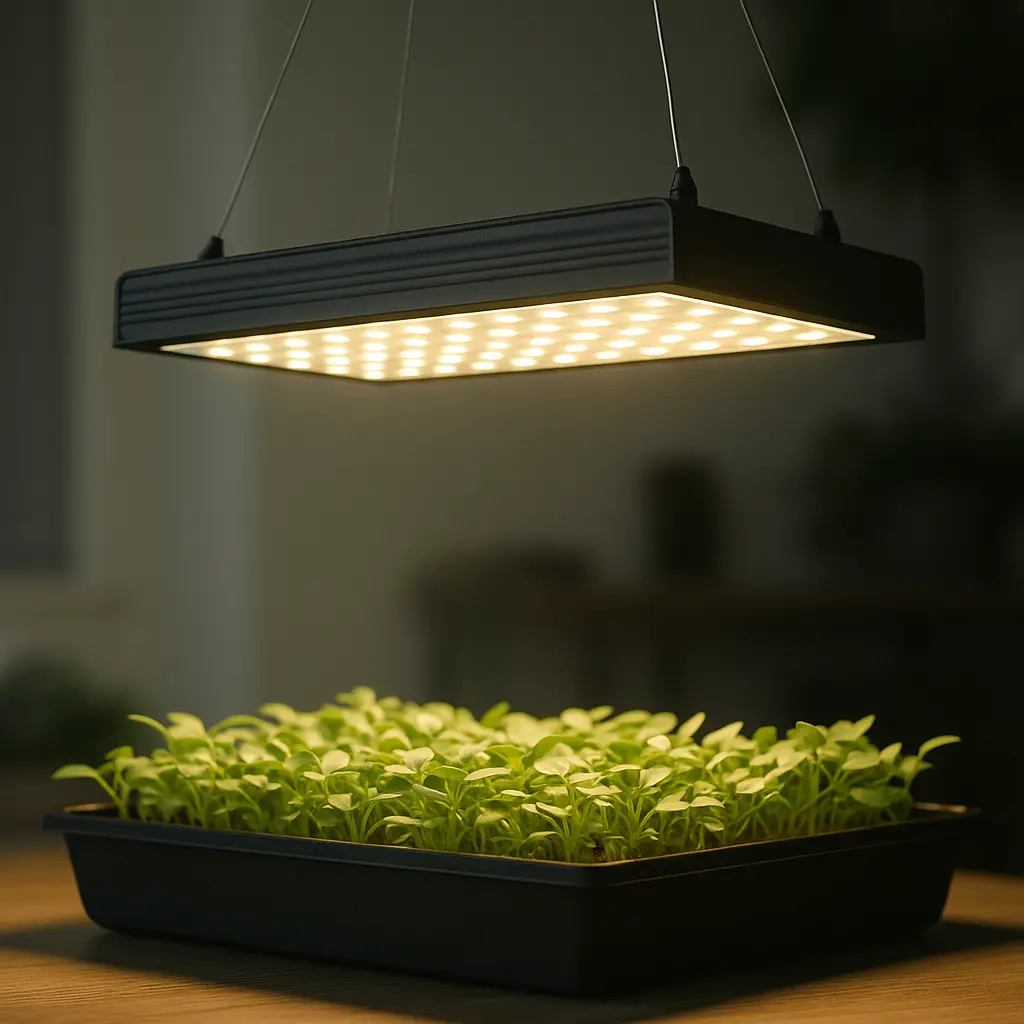
PAR stands for Photosynthetically Active Radiation. It refers to the 400 to 700 nanometer region of the light spectrum commonly used to describe the light available for photosynthesis.
In simple terms:
PAR describes the part of visible light that plants can use for photosynthesis.
This simulator estimates how light from your fixture spreads across the grow area so you can compare hanging height, beam angle, coverage, and estimated PPFD at canopy level.
1. PPF vs. PPFD: What's the Difference?
Two terms appear constantly when comparing grow lights: PPF and PPFD. They are related, but they describe different things.
- PPF (Photosynthetic Photon Flux): The total amount of PAR photons emitted by a light source each second. It is measured in micromoles per second (µmol/s).
- PPFD (Photosynthetic Photon Flux Density): The amount of PAR reaching a square meter of plant canopy each second. It is measured in micromoles per square meter per second (µmol/m²/s).
A fixture can have a high PPF but still produce relatively low PPFD if that light is spread over a large area. PPFD is therefore especially useful when estimating how much usable light actually reaches the leaves.
2. Why Hanging Height Changes PPFD
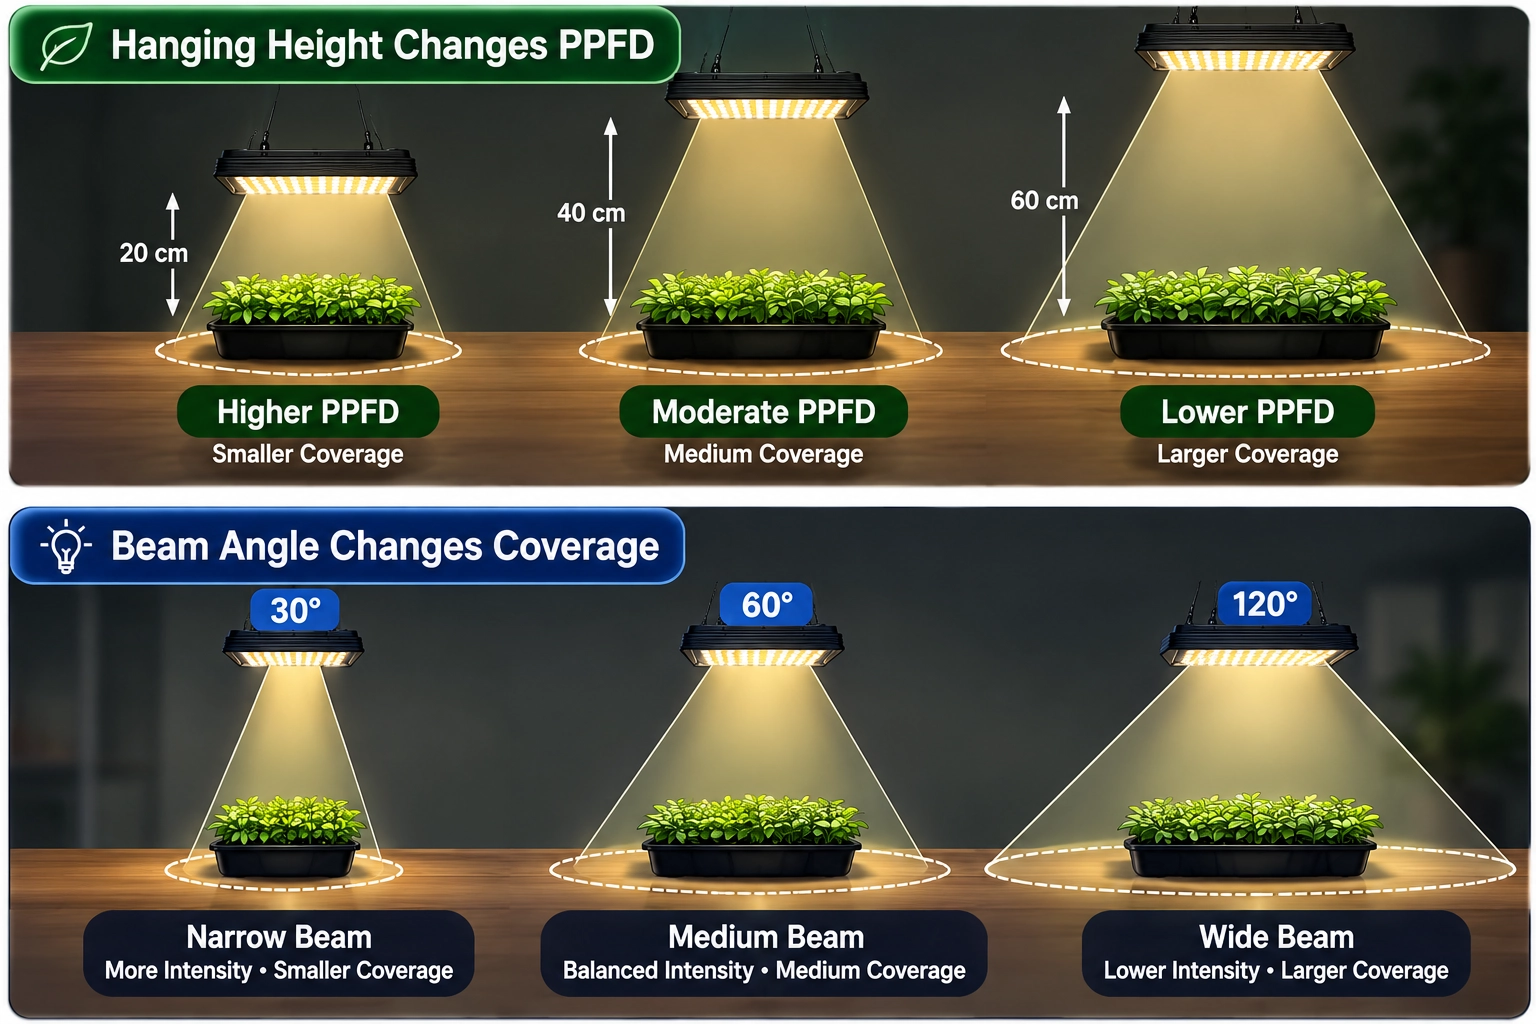
As a grow light is raised, its beam spreads across a larger area. The fixture is still producing roughly the same total PPF, but those photons are distributed over more space. The average PPFD at the canopy therefore decreases.
Lowering the fixture usually creates a smaller, more intense footprint. Raising it increases coverage but reduces average intensity.
- Lower height: smaller coverage area and higher estimated PPFD.
- Greater height: larger coverage area and lower estimated PPFD.
- The goal: find a height that provides enough intensity while still covering the canopy evenly.
Real fixtures do not distribute light perfectly evenly, so the center of the grow area may receive more light than the edges. The simulator gives you a useful average rather than a complete PPFD map.
3. How Beam Angle Changes Coverage
Beam angle describes how widely a fixture spreads its light. A narrow beam concentrates photons into a smaller footprint, while a wide beam spreads them across a larger area.
- Narrow beam: more concentrated light and a smaller footprint.
- Wide beam: broader coverage with lower average intensity.
- Fixture height matters too: the same beam angle covers more area as the light is moved farther from the canopy.
The simulator combines your selected beam angle and hanging height to estimate the circular footprint of the light, then divides the fixture's PPF across that area.
Quick Legend
- PPF (µmol/s): total PAR photons emitted by the fixture each second
- Height (cm): distance from the light to the plant canopy
- Beam Angle (degrees): approximate width of the light cone
- PPFD (µmol/m²/s): PAR photons reaching each square meter of canopy per second
4. Try the PAR Simulator
Enter your grow light's PPF, its height above the canopy, and the approximate beam angle. The simulator estimates the illuminated area and average PPFD within that footprint.
5. Understanding Your PPFD Result
The number produced by the simulator is an estimate of average PPFD at canopy level. It represents light intensity at that moment, not the total amount of light the plant receives over an entire day.
A higher PPFD means more photosynthetically active photons are reaching the canopy each second. Whether that is desirable depends on the plant, its stage of growth, the number of hours the light operates each day, temperature, water, nutrition, and other growing conditions.
For example, vegetable seedlings commonly perform well under roughly 200-400 µmol/m²/s. Mature plants and high-light crops may require substantially different levels, so always consider the requirements of the species you are growing.
6. PPFD Is Not the Same as Daily Light
PPFD tells you how much PAR is arriving each second. Plants, however, experience that light over many hours. The accumulated amount of PAR received during a full day is called the Daily Light Integral (DLI).
This means two plants receiving the same PPFD can receive different daily amounts of light if one fixture runs for 10 hours and another runs for 16 hours.
For now, use the PAR Simulator to compare fixture intensity and coverage. When planning an entire growing schedule, also consider how many hours per day the light will operate.
7. Getting Better Results From the Simulator
The quality of the estimate depends on the information you enter. For the most useful result:
- Find the fixture's actual PPF. Check the manufacturer's specification sheet for a value in µmol/s. Do not confuse PPF with wattage, lumens, or efficiency expressed in µmol/J.
- Measure from the fixture to the canopy. Use the actual distance to the tops of the plants rather than the height of the fixture from the floor or growing table.
- Use the manufacturer's beam angle when available. If none is published, experiment with several reasonable values to see how much the estimated footprint changes.
- Compare several heights. Try the same fixture at 20, 30, 40, and 50 cm to see the tradeoff between intensity and coverage.
- Verify important setups with measurements. A PAR or quantum meter at canopy level provides much better information about the real fixture than a geometric estimate alone.
8. Why Real PPFD May Differ
This simulator uses a simplified geometric model and assumes that the fixture's PPF is distributed uniformly throughout a circular beam. Real grow lights are more complicated.
Actual PPFD can vary because of:
- fixture shape and diode placement
- lenses, reflectors, and secondary optics
- uneven intensity between the center and edges of the beam
- reflective walls or grow-tent surfaces
- multiple fixtures with overlapping footprints
- plant height and canopy shape
- manufacturer PPF tolerances
Use the simulator for planning, comparisons, and understanding the relationship between PPF, height, beam angle, and coverage. For precision growing, measure actual PPFD at several points across the canopy with a suitable PAR meter.
LEDHost Tip
A bigger PPFD number is not automatically better. The useful setup is the one that gives your plants enough light while covering the canopy evenly. Use the simulator to compare possibilities, then let real measurements and plant response guide the final adjustment.
More in the Tool Zone
Frequently Asked Questions
Ask a Question
All questions are reviewed before publishing.